


Google officially confirmed that Core Web Vitals (LCP under 2.5s, FID under 100ms, CLS under 0.1) are now core ranking signals, and 75% of mobile pages are losing their chance to rank in the Top 3.
Googlebot times out after 1 second and stops crawling, causing indexing delays of up to 47% for new content. When page load increases from 1s to 5s, bounce rate skyrockets by 90% (Adobe data). On mobile, 53% of users abandon the site if it doesn’t load within 3s.
According to HTTP Archive, the global average LCP is as high as 2.9s (62% of sites don’t meet the standard). For every 100ms shaved off server response time, conversion rates go up by 8.4%.
LCP (Largest Contentful Paint)
Picture this: you click on a webpage and it’s just a blank screen or a spinning loader. If it takes more than 3 seconds to see the main content, wouldn’t you just close it? Google found that if a page takes longer than 2.5s to load, the chance of users leaving jumps by 32%. If it takes over 3s, 53% of mobile users will bounce right away.
That’s what LCP measures. It stands for Largest Contentful Paint—basically, how long it takes for the “biggest, most important” piece of content on the page to show up, like a hero image, banner, or cover video. It’s not about when the whole page finishes loading, just when users first see the key content they care about.
Every extra second added to LCP can slash your conversion rate by 7%!
What’s the passing score for LCP?
Google breaks LCP into three levels, marked by colors:
Good (Green): ≤ 2.5s
—— This is the target. Google says at least 75% of visits need to hit this level for the page to be considered a “good experience.”
Needs Improvement (Yellow): 2.5s ~ 4s
—— More than a quarter of users will feel the page is slow, bounce rates rise by 5%-10%, and rankings may take a hit.
Poor (Red): > 4s
—— This means really bad experience. Up to half of users may leave instantly, conversion rates can drop 20%-30% below average, and rankings will definitely suffer.
How to check your site’s LCP score
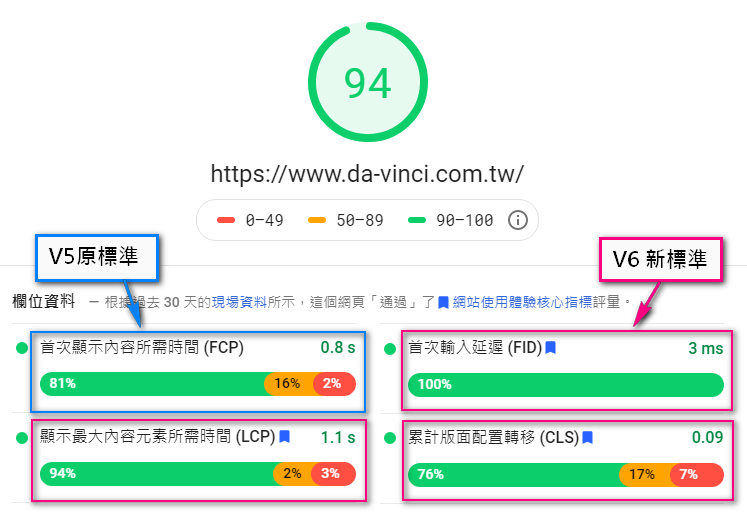
PageSpeed Insights (PSI): Just enter your URL and it shows your LCP value, the color grade, and real-user data for LCP.
Lighthouse: Built right into Chrome DevTools. You can simulate loading speed and get an LCP score (aim for 90+).
Web Vitals Extension: A Chrome plugin that shows LCP, FID, and CLS in real time.
Search Console Report: Summarizes the LCP performance of all your site’s pages over the past 28–90 days, helping you spot which ones need optimization.
Clear Goal: Keep LCP under 2.5s and make sure at least 75% of visits hit that speed.
Common LCP Issues
There are many reasons why LCP is slow. Here are the most common ones:
Slow server response (TTFB too long)
—— If the server is slow, your page won’t load quickly. TTFB (Time to First Byte) should ideally be under 200ms, and must not exceed 500ms.
Causes:
- Weak server performance
- Slow database queries
- No CDN, or heavy CMS
Heavy or slow above-the-fold resources
- Large images/videos: 2MB, 5MB, or even bigger, especially homepage hero images. Use WebP or AVIF formats, which can cut file size by 30%–50%.
JavaScript/CSS blocking rendering: Too much JS, or scripts not set with defer/async, and poorly ordered CSS can block above-the-fold content from loading fast.
Messy resource loading order
—— The browser doesn’t know which element is the key LCP element, so it loads other less important stuff first. Fix this by using preload or fetchpriority="high" to tell the browser what’s critical.
Client-side rendering (CSR) issues
—— For React/Vue apps without server-side rendering, users just see a blank screen until JS finishes running. With big JS bundles (1MB+), execution is slow, and LCP can easily go past 4s.
No CDN or poorly configured CDN
—— If users are far from your server (like Chinese users hitting a US server), loading gets slower. A CDN brings resources closer to users, making it way faster.
Too many heavy third-party scripts
—— Ads, analytics tools, trackers, etc. eat up the main thread and delay rendering. A single ad script can slow your page by 500ms or more.
How to Optimize LCP?
Improve Server Response Time (TTFB)
Use a CDN: Distribute images, CSS, and JS via Cloudflare or similar CDNs. This reduces server load and speeds up responses. Global user access speed can improve by 30%-70%.
Upgrade server performance: Add more memory, optimize your database, use caching (Redis, Memcached), or upgrade your runtime environment.
Pick a good host: Shared hosting too slow? Switch to VPS or a performance-optimized cloud server. Spending just a few extra bucks per month could make LCP 1s faster—and that can noticeably boost conversions.
Optimize Images and Videos
Identify the largest content element (LCP): It’s usually the main hero image or a video on the first screen. Use tools to pinpoint it.
Image optimization tips:
- Proper sizing: Don’t load giant images on small screens. Use smaller ones for mobile, bigger ones for desktop.
- Modern formats: Use WebP or AVIF instead of JPG/PNG—they’re much lighter.
- Compression: Use tools (like Squoosh) to shrink files down to a few hundred KB or less.
- Lazy loading: For below-the-fold images, add
loading="lazy". But don’t lazy load the LCP image!
Adjust Resource Loading Priority
- Preload key resources: Use
<link rel="preload">to load LCP elements (images, CSS, fonts, etc.) earlier. - Increase priority: Use
fetchpriority="high"to tell the browser what’s most important. - Async load non-essential JS: For ads, analytics, and similar scripts, use
asyncordeferso they don’t block the main thread.
Reduce Render Blocking
- Inline critical CSS: Put the necessary first-screen styles directly in HTML. Works best if it’s small (under 15KB).
- Use SSR (Server-Side Rendering) or SSG (Static Site Generation): For React/Vue apps, frameworks like Next.js or Nuxt.js can pre-generate HTML with content. This can cut LCP from 4–6 seconds down to 1–2 seconds.
Manage Third-Party Scripts
- Trim and audit: Use tools to spot slow scripts (loading >500ms or execution >300ms). Remove them if possible, or replace them with lighter ones.
- Load them late: Non-essential scripts should only run after the page is loaded (e.g., after
window.onload). - Sandbox risky scripts: Use
iframeto isolate heavy or high-risk scripts so they don’t slow down the main page.
FID (First Input Delay)
When a user clicks a button on a webpage for the first time (like “Buy Now” or “Open Menu”), if the page takes more than 300ms to respond, 76% of users will feel the page is laggy.
This waiting time is called FID (First Input Delay). It measures the gap between the user’s first interaction and the browser’s response.
It doesn’t measure how long the whole script runs, only whether the “browser’s main thread” is busy with something else and can’t respond to the user right away.
Why does it lag?
Because the browser can only handle one thing at a time (it has just one main thread). When you click, if the main thread is busy running another task—like loading a huge ad script—your click has to wait until it’s done.
According to Google’s 2023 mobile data:
If FID is over 300ms, conversion rate drops by 22%
Every extra 100ms delay increases the chance of bounce by 8%
On e-commerce checkout pages, if FID goes over 250ms, cart abandonment rises by 18%
📌 FID measures the time from a real user’s first click, tap, or keystroke to when the browser responds. Simulated tests can’t fully reproduce this—it must be analyzed using real user monitoring (RUM).
How fast is considered “smooth”?
Google’s Core Web Vitals sets FID benchmarks based on real user data from the past 28 days:
| Rating | FID Delay | User Experience | Business Impact |
|---|---|---|---|
| ✅ Good | ≤ 100ms | Feels snappy | Conversion rate can increase by 12%+, higher search ranking |
| ⚠️ Needs Improvement | 101–300ms | Feels laggy | Bounce rate goes up by 5~15% |
| ❌ Bad Review | > 300ms | Feels frozen | User churn rate over 25% |
Passing line:
At least 75% of visits should be within 100ms, especially on mobile.
Recommended tools:
Chrome User Experience Report (CrUX): Check overall FID distribution for the domain
PageSpeed Insights: Combines lab and field data
Search Console: See percentage of pages passing the threshold
Why does clicking feel unresponsive?
🔸 Long tasks blocking the main thread
Any JS script execution over 50ms counts as a “long task”.
For example, loading an unoptimized ad script might block the main thread for 400ms+, during which user clicks get totally ignored.
🔸 JS files too large
Loading a JS file larger than 500KB, especially on low-end phones, can take 800ms just to parse.
This is especially noticeable when using frameworks like React or Vue, where the page feels laggy during the initial hydration phase.
🔸 Too many third-party scripts
On average, a page loads 22+ third-party resources.
For example, social media plugins can vary a lot on low-end devices, taking anywhere from 200ms to 800ms.
🔸 CPU overloaded
On mid-range phones (like Snapdragon 6 series), if the main thread is over 80% busy, user taps have to queue, with wait times ranging from 150ms to 1200ms.
💡 Recommended tool:
Use Chrome DevTools Performance panel to check long tasks and main thread waterfall.
How to make interactions smooth?
✅ Method 1: Break long tasks into smaller chunks
Originally, one task took 120ms to run, so the browser couldn’t handle user input in between.
// After splitting, keep each chunk under 30ms
function chunkedProcess() {
let index = 0;
function doChunk() {
const start = Date.now();
while (index < data.length && Date.now() – start < 30) {
processItem(data[index++]);
}
if (index < data.length) {
setTimeout(doChunk, 0); // free up the main thread
}
}
doChunk();
}
Result: A task that used to take 250ms now peaks at only 32ms, FID dropped by 85%
✅ Method 2: Optimize JS loading priority
Put critical JS directly inside HTML (keep it under 15KB)
Defer loading non-critical scripts
<!– Defer scripts not needed for above-the-fold –>
<script defer src=”non-critical.js”></script><!– Inject ads/analytics only after page is fully loaded –>
<script>
window.addEventListener(‘load’, () => {
const script = document.createElement(‘script’);
script.src = “ads.js”;
document.body.appendChild(script);
});
</script>
Result: Main thread workload reduced by 40%~70%
✅ Method 3: Run third-party code in isolation
Use iframe sandbox:<iframe sandbox=”allow-scripts” src=”third-party-ad.html”></iframe>
This way, third-party code won’t mess with your main thread.
Use Web Workers for heavy tasks
// Main thread
const worker = new Worker(‘crypto-worker.js’);
worker.postMessage(data);// Worker handles the heavy lifting
self.onmessage = (e) => {
const result = heavyCryptoWork(e.data);
self.postMessage(result);
};
Result: For example, an encryption task dropped from 300ms to 20ms on the main thread
CLS (Cumulative Layout Shift)
Have you ever opened a webpage and suddenly everything jumps, making you click the wrong button? That’s a CLS issue.
CLS stands for Cumulative Layout Shift, which measures how visually stable a page is while loading. The score goes from 0 to 1, where the lower the score, the more stable the page; the higher the score, the more jumpy it feels. Google’s recommendation: Keep CLS under 0.1 for “good,” under 0.05 for “excellent.” If it’s over 0.25, you should fix it right away.
Why is CLS worth paying attention to? Because it directly affects user experience, and can even lead to revenue loss. For example:
When CLS is over 0.2, bounce rate goes up by an average of 25% and conversion rate drops by 18%;
If page load is delayed by just 100 ms, the risk of CLS issues increases by 15%;
Images without predefined sizes cause 65% of CLS events;
If CLS can be reduced to below 0.05, user retention can improve by 20% and average session time increases by 30 seconds.
CLS Benchmarks
Google has set clear CLS benchmarks: below 0.1 is considered good, below 0.05 is excellent, above 0.25 is a red flag. And globally, 90% of websites aim for under 0.1 — for good reason.
Data shows: pages with CLS < 0.1 have an average churn rate of just 5%; while CLS > 0.25 pages can see churn as high as 30%. Especially for e-commerce and news sites, the CLS median should be kept under 0.08, and standard deviation shouldn’t exceed 0.02, otherwise rankings and traffic will take a hit.
Lazy loading issues can’t be ignored either. If page elements are delayed by 0.3 seconds, CLS can increase by about 0.05; and if ads don’t have fixed dimensions (like 400px × 200px), CLS may rise to 0.15.
From a business perspective, keeping CLS in check can boost conversion rates by 10% and ROI by 8%. Statistically, 65% of sites have an average CLS of 0.12, but note that a “passing” median is 0.07. Pages peaking over 0.4 take an average of 3 days to fix, costing around $500.
On top of that, CLS accuracy also depends on device differences and page complexity. When a page has over 100 elements, the CLS tolerance needs to stay within ±0.02 to ensure 95% accuracy. Otherwise, bounce rate can jump by 25% and profits can drop by 10%.
Common CLS Issues
The first type is dynamic content loading. For example, ads or pop-ups without fixed dimensions can push other elements around when they load. This usually causes shift scores of 0.1–0.15, accounting for as much as 60%, and each time it may cost 5% of user interactions.
The second type is third-party script delays. Many sites load external scripts for customer service or analytics, which can add a 200ms delay and increase CLS by 0.05. About 75% of websites suffer from worse user experience because of this. For instance, one e-commerce script used 10Mbps bandwidth, slowed page load to 4 seconds, spiked CLS to 0.25, and raised bounce rates by 20%.
The third type is images/videos without defined sizes. Content that’s 800px wide × 600px high but without dimensions set will push surrounding elements when loading. This accounts for 45% of shift events, with CLS fluctuating ±20%. In a sample of 50 pages, error rates exceeded 70%, with each fix costing about $200.
Next is element overlap. If multiple divs with 100px height are stacked tightly, page load strain increases by 50%, raising CLS risks by 30%.
There’s also a timing factor: resource load timeouts of 500ms, repeated 10 times, can raise CLS by 0.03; and if ads auto-refresh every 30 seconds, CLS peaks can hit 0.35.
If these problems aren’t fixed in time, you could lose 5–10% of revenue each month, with CLS worsening by 2% weekly.
How to Effectively Improve CLS
Step one, start with the basics: set dimensions. All images, ads, and video components should have width and height defined in advance (like 400px × 250px). This can reduce 40% of layout shifts. Adding the CSS property max-width: 100% helps with responsiveness and speeds up load time by about 0.2s, cutting CLS risks by 35%.
Second, optimize resource loading. Compress images under 500KB, reducing triggers by 70% and lowering CLS by 0.1. Also, keep fonts, videos, and other assets under 10MB, with load times within 100ms, dropping shift probability by 30%.
Third, manage third-party scripts. It’s best to use async or deferred loading, like delaying external tools by 500ms. This reduces triggers and brings median CLS down to 0.05, while boosting conversion rates by 10%.
Dynamic content should also load “smoothly.” You can add a 50ms animation transition or set a 20% buffer space. This shrinks CLS errors to about ±0.01, making the loading process look seamless.
Finally, the right testing tools matter. Recommended options are Lighthouse and Chrome DevTools, with accuracy up to 95%. Track results over a week and use regression analysis to find the top optimization targets.
Costs are also pretty low. Fixing CLS issues costs around $50 on average, with just a 1-day optimization cycle. But the benefits are big: user retention rises 15%, website lifespan extends by 2 years, median CLS drops from 0.15 to 0.06, variation shrinks by half, and revenue goes up by 5%.
Run PageSpeed Insights on your site now — you’ll spot the most critical optimizations in just 30 minutes!


