


In the 8.5 billion searches Google processes daily, 46% have clear shopping intent—yet 90% of e-commerce websites can’t even crack the first page. Data shows that optimized product pages can lead to a 217% increase in search traffic (Ahrefs, 2024).
Platform sellers pay for traffic, but independent stores (DTC) can use SEO to make customers come to them proactively. For example, a precise Schema markup can earn a product 35% more clicks in search results, and a video-based customer review can directly increase the average order value by 19% (Baymard Institute).
The opportunity in 2025 lies in: Google’s AI Search (SGE) is changing the rules of traffic distribution, and visual search (Google Lens + Pinterest) already accounts for 12% of e-commerce traffic (Tinuiti Report).
Choosing the Right SEO Tools
In the e-commerce industry, 90% of traffic is concentrated on the first page of search results (Advanced Web Ranking, 2024), but most sellers can’t even get into the top 50.
Where is the problem? 46% of e-commerce websites do not systematically analyze keywords (Ahrefs Industry Report), leading to a complete mismatch between advertising terms and the actual terms users search for. For instance, a seller might optimize for “high-end women’s clothing,” but the real higher-volume search is for “slimming dress 2024 new arrival.”
E-commerce websites using professional SEO tools have an average of 73% higher organic search traffic (Search Engine Journal, 2023). For example, SEMrush can analyze competitor traffic sources, Ahrefs tracks keyword ranking changes, and Google Keyword Planner provides accurate search volume forecasts.
Why Tools Are More Reliable Than Intuition?
Most sellers habitually choose terms based on experience, for example, assuming “fashion bags” must have higher traffic than “niche crossbody bags,” but the data often proves the opposite. According to a Moz study, long-tail keywords (3-5 word phrases) have a 47% higher conversion rate than generic terms because the search intent is clearer. For example, “genuine leather women’s bag lightweight large capacity” might have 1/10 the search volume of “women’s bag,” but the purchase intent is 3 times stronger.
Taking Ahrefs as an example, entering a product term can list:
- Actual search volume
- Competition difficulty
- Click-through rate (CTR) estimate
- Related term recommendations
For instance, a pet supplies seller found that “automatic feeder” was highly competitive, but “cat feeder with camera” had stable search volume and fewer competitors. After adjusting, their organic traffic grew by 210% within two months.
Google’s algorithm updates several times a month. Tools like SEMrush can monitor position changes daily; if a term suddenly drops, it might be due to a competitor optimizing content or Google adjusting rules, allowing for a timely response.
Three Essential Tools
Google Keyword Planner
This is Google’s official free tool, and its core function is to distinguish between terms “imagined to be popular” and those “actually searched.” For example, a home goods seller initially thought “Nordic style coffee table” was the main term, but data showed “small living room coffee table with storage” had 4 times the monthly search volume.
Usage Tips:
- Focus on “average monthly searches” and “competition level.” Prioritize terms with search volume of 500-5,000 and medium competition.
- Combine with the “Trends” feature to avoid seasonal fluctuations. For example, “Christmas decorations” peak from October to December but are barely searched in other months of the year.
Ahrefs
Ahrefs’ “Site Explorer” can dissect the SEO structure of any website. Entering a competitor’s URL reveals:
- They rank for high-traffic keywords (e.g., “sports water bottle leak-proof” ranks #3 on Google)
- The external links that drive the most traffic (e.g., a review article by a fitness blogger brings 30% of the traffic)
- Content gaps (terms competitors haven’t covered but users are searching for)
Case Study: A digital accessories seller found that a competitor gained massive traffic from “iPhone 14 phone case anti-drop,” but “iPhone 14 Pro Max ultra-thin case” was hardly optimized by anyone. After capturing this term, their single-month sales increased by 18%.
SEMrush
SEMrush’s “SEO Content Template” feature provides direct content suggestions. Entering a target keyword will tell you:
- Ideal length (e.g., “articles over 2000 words rank higher”)
- Mandatory subtopics to include (e.g., “waterproof Bluetooth headphones” should mention “IPX7 rating,” “battery life”)
- Related term recommendations (e.g., “sports headphones won’t fall out” and “swimming headphones” should be included in the article)
An outdoor gear seller used this to rewrite 10 product descriptions, and within 6 months, relevant keyword rankings rose from page 48 to page 1.
Low-Cost Alternatives
Ubersuggest’s “Content Ideas” feature can automatically generate 30 related topics. For example, entering “coffee machine” will recommend extended content like “how to clean a home coffee machine.”
AnswerThePublic captures real user questions, discovering conversational queries like “does an air fryer need to preheat,” which are better suited for voice search optimization.
Google Trends’ related term comparison is especially useful. For example, comparing the search trends of “yoga mat” and “fitness mat” simultaneously, you might find that the latter’s popularity surpasses the former by 15% during the January fitness peak season.
If you cannot currently afford Ahrefs ($99/month starting) or SEMrush ($119.95/month), you can use the following combination:
- Free version of Google Keyword Planner + Ubersuggest (a tool developed by Neil Patel, $29/month, functionally close to Ahrefs Basic)
- AnswerThePublic (free version available, for digging into real user questions, e.g., “is an air fryer worth buying”)
- Google Trends (free, identifies trending terms, e.g., “camping tent” search volume spikes in spring)
For example, a niche beauty brand used Ubersuggest to find that “vegan lipstick long-lasting” search volume was rising but had minimal competition. After quickly optimizing, they became the top-ranking store for that term.
You might also want to read: No Money for Ahrefs/SEMrush | Find High-Traffic Keywords Without Spending a Penny (Plus 5 Tool List)
Choosing a User-Friendly E-commerce Platform
In Google searches, 53% of e-commerce traffic is captured by independent stores (DTC) (Statista, 2024), but the SEO performance of different platforms varies significantly. Shopify stores’ average organic search traffic is 22% lower than Magento (Ahrefs Industry Report), and WooCommerce sites have a 34% higher compliance rate for mobile core performance indicators (Google Core Web Vitals data).
Ease of use and SEO potential are often inversely related. For example, while the SaaS model BigCommerce allows for one-click setup, its URL structure is rigid, causing 38% of sellers to be unable to optimize product page hierarchies (Moz testing data). Open-source systems like WooCommerce allow for deep modification but require technical team support.
Google’s algorithm favors websites with loading speeds below 1.8 seconds and structured data completeness exceeding 80% (Search Console’s latest standard), which directly eliminates most traditional e-commerce systems.
Three Mainstream Platforms
Shopify’s SEO shortcoming is its URL structure; all product pages must include the /products/ prefix, which prevents custom categorization, causing one home goods brand to lose 25% of its category page indexation.
While WooCommerce supports complete SEO control, tests show that stores without caching configured have a mobile LCP compliance rate of only 19%, far below the industry average.
BigCommerce’s automatic canonical tags effectively prevent duplicate content, but the product description length limit forced one electronics accessory seller to cut 30% of their keyword coverage.
Shopify
Shopify holds 28% of the independent store market share (BuiltWith data), but its default settings are not SEO-friendly:
- URLs are forced to include the
/products/prefix, preventing custom hierarchies (e.g., cannot change to/category/product-name) - The blogging system is weak, limiting content marketing (only 12% of Shopify stores run a blog)
- Relies on third-party plugins (like Smart SEO) for basic features, resulting in an additional annual expenditure of $200+
Real-world Case: After switching to Shopify, a clothing brand saw 40% of its product pages unindexed by Google due to duplicate meta tag issues. Traffic recovery took 3 months after fixing it with a plugin.
WooCommerce
WooCommerce, based on WordPress, supports 100% SEO customization but requires optimization:
- Caching plugins (like WP Rocket) must be configured to meet Google’s loading speed requirements
- Schema markup for product pages requires manual or plugin addition (like Rank Math)
- Database bloat is common; page load delay increases by 1.4 seconds when exceeding 5,000 SKUs (GTmetrix test)
Data Feedback: Websites using WooCommerce with proper technical setup have a 63% higher rich snippet display rate than the industry average (Schema.org official statistics).
BigCommerce
BigCommerce’s SEO advantages include:
- Automatic Canonical tag generation, reducing duplicate content risk (55% less than Shopify’s similar issues)
- Built-in AMP support, making mobile page speed 29% faster than traditional solutions (Google test)
- However, the product description field is limited to 2,000 characters, affecting the depth of long-tail keyword coverage
Industry Data: BigCommerce stores’ average organic search traffic growth rate is 15% higher than Shopify’s (2023 Enterprise User Survey).
Impact of Technical Metrics on Search Ranking
Every 0.1-second increase in page load speed boosts crawler crawl frequency by 17%. Stores using edge computing index 3 times faster than traditional hosting. Websites using dynamic rendering for mobile adaptation load the first screen 40% slower than responsive design but have 65% lower maintenance costs.
In structured data markup, product pages including the availability attribute have 72% higher visibility on Google Shopping than unmarked pages, but price synchronization delay must not exceed 15 minutes.
In Google’s ranking algorithm, Page Experience weight has risen to 40% (Searchmetrics latest research), specifically shown by:
Loading Speed Directly Determines Crawler Crawl Frequency
- Websites with a Time to First Byte (TTFB) exceeding 600 milliseconds see a 22% reduction in indexation (Google crawler log analysis)
- E-commerce platforms using CDN have a 47% increase in Core Web Vitals compliance (Cloudflare data)
Mobile Adaptability Is No Longer Optional
- Pages that fail the mobile-friendly test see an average search ranking drop of 8 positions (Google official statement)
- Websites using responsive design have a 31% lower bounce rate than separate mobile sites (Baymard Institute)
Missing Structured Data Leads to Loss of Rich Snippets
- Pages including Product Schema see a 35% increase in click-through rate (Search Engine Land experiment)
- However, Shopify Basic requires a paid plugin to add Review markup, increasing costs by $15/month
Opportunities for Niche Platforms
Under the Headless architecture, one sports brand achieved an LCP of 0.8 seconds using Next.js but requires continuous investment in front-end engineer resources.
PrestaShop’s multilingual SEO advantage is significant; a German site test showed localized URLs increased conversion rates by 22%, but hreflang tags need to be manually managed for each language.
Squarespace’s visual search optimization increased the click-through rate of a jeweler’s product images by 35%, but anything over 300 SKUs requires switching to external image library management.
Headless Commerce (e.g., CommerceJS)
- By separating the front-end and back-end, page load speed can reach 1.2 seconds (WebPageTest actual measurement)
- However, development costs are 3-5 times higher than traditional solutions, suitable for brands with well-equipped technical teams
PrestaShop (Preferred in the European Market)
- French and Spanish keyword coverage is 28% stronger than Shopify (SEMrush multilingual analysis)
- But the plugin ecosystem is chaotic; SEO optimization requires self-written modules
Squarespace (Design-Oriented Choice)
- Visual search (Google Lens) image recognition accuracy is 19% higher than the average (Jumpshot data)
- However, the navigation structure can easily become confusing when the product catalog exceeds 500 items
Finding the Right Keywords
In Google search, 68% of e-commerce traffic comes from the top 5 search results (Advanced Web Ranking, 2024). Incorrect keyword selection leads to a 42% increase in page bounce rate (Google Analytics benchmark data), while phrases that accurately match user search intent can increase conversion rates by 28% (Search Engine Land experiment). For example, a home goods brand initially thought “modern sofa” was the core term, but the term with higher actual search volume was “small apartment fabric sofa washable”—directly leading to a 35% loss of potential customers in their organic traffic.
The core value of keyword research is to replace guesswork with data. According to Ahrefs’ statistics, e-commerce websites that use professional tools to analyze keywords have an average page ranking 11 positions higher than their competitors. Google Keyword Planner shows that long-tail keywords (combinations of 4-6 words) have a 53% higher conversion rate than generic terms, even with lower search volume, because user intent is clearer. For example, the purchase intent strength of “wireless Bluetooth headset sports waterproof” is 3.2 times that of “Bluetooth headset” (SEMrush behavioral analysis).
Distinguishing Between Three Types of Search Intent
Google judges terms like “where to buy” and “how much” as having purchase intent. Although these searches only account for 32%, their conversion value is 5 times that of ordinary terms. For example, for informational searches like “coffee machine repair guide,” users browse an average of 4.2 pages, 3 times that of transactional searches.
While brand terms like “Dyson hairdryer” have precise traffic, data shows that non-brand terms account for up to 78% of new users, making them key to expanding the customer base.
You might be more interested in this article: Are Keywords with Monthly Search Volume Below 10 in Niche Industries Worth Doing SEO For?
Google’s algorithm automatically determines the intent type based on the user’s search term, and a website must match this to rank:
Transactional Keywords (Direct Purchase Intent)
- Characteristics: Includes commercial intent words like “buy,” “price,” “discount”
- Data: These terms account for 32% of e-commerce searches but have the highest competition (Ahrefs difficulty score averages 68/100)
- Case: “iPhone 15 Pro Max 256GB price” has a monthly search volume of 1.2 million, but the top 10 are giants like Amazon/Best Buy
- Optimization Strategy: Product pages need to highlight price, stock status, and the position of the “Add to Cart” button
Informational Keywords (Product Research Phase)
- Characteristics: Includes comparison words like “review,” “vs,” “best”
- Data: Traffic from these terms has a 45% lower conversion rate than transactional terms, but users stay on the page 3 times longer (Hotjar monitoring)
- Case: “Dyson vs Shark vacuum cleaner” has a monthly search volume of 240,000, suitable for creating comparison guides to drive traffic
- Optimization Strategy: Create blog/guide content, embed product links
Navigational Keywords (Brand-Related Searches)
- Characteristics: Includes brand names or models
- Data: Brand terms account for 28% of e-commerce searches, but new customer acquisition cost from non-brand terms is 62% lower (Google Ads statistics)
- Case: 71% of searches for “Nike Air Force 1” already include the brand term
- Optimization Strategy: While optimizing brand terms, expand through related terms (e.g., “what to wear with Nike Air Force 1”)
Four-Step Keyword Filtering Process
First, use a tool to pull out 500 candidate terms. A pet supplies seller found “automatic feeder” had a monthly search volume of 180,000 via Google Keyword Planner, but “silent cat feeder” had 60% lower competition.
Then manually filter, deleting irrelevant terms like “cat pictures.” Focus on selecting long-tail combinations of 3-5 words. For example, the conversion rate for “maternity anti-radiation clothing silver fiber” is 28% higher than for simply searching “anti-radiation clothing.”
Finally, validate the intent. For instance, search for “air fryer cleaning.” If the top 10 results are all video tutorials, it suggests a need to produce video content.
You might need to read this article: What Tools to Use for Checking Keyword Search Volume | Google Trends/SEMrush/Ahrefs User Guide
Get Raw Data with Tools
- Google Keyword Planner provides search volume and competition level
- Ahrefs’ “Keyword Difficulty” score predicts ranking difficulty
- AnswerThePublic uncovers question-based long-tail keywords (e.g., “does an air fryer need to preheat”)
Filter Low-Value Keywords
- Exclude keywords with search volume <100/month (unless conversion rate is extremely high)
- Exclude words with unclear commercial intent (e.g., “how to draw a sofa” is useless for a furniture seller)
- Exclude words with difficulty score >70 (unless authoritative content already exists)
Prioritize Long-Tail Combinations
- 3-5 word keyword phrases have a conversion rate 37% higher than single-word keywords (Moz study)
- Case: “Maternity radiation shield silver fiber” has a 28% higher conversion rate than “radiation shield”
Validate Search Intent Match
- Actually search the term on Google and check the type of currently ranking pages
- Use SEMrush’s “Top Pages” to analyze how competitors optimize for the term
2025 Keyword Strategy Upgrade
Google’s AI summaries prioritize Q&A content, and pages adding FAQ modules have seen a 40% increase in display rate within SGE. For image search, a furniture merchant adding “Nordic style solid wood dining table” to the alt text saw a 35% growth in traffic from Google Lens. Voice search optimization requires natural language, such as adding conversational questions like “Can this bag fit a 15-inch laptop”.
Coping with Google SGE’s Impact
- AI summary will intercept 17% of traditional search traffic (Google test data)
- Countermeasure: Optimize Q&A content (FAQ Schema) to compete for the featured snippet position
Visual Search Keyword Optimization
- Google Lens/Pinterest contribute 12% of e-commerce search traffic (Tinuiti report)
- Countermeasure: Image alt text must include product attribute words (e.g., “Nordic style ceramic vase handmade underglaze”)
Voice Search Adaptation
- 53% of queries in voice search are in natural language form (e.g., “where can I buy a durable suitcase”)
- Countermeasure: Integrate conversational Q&A modules into content
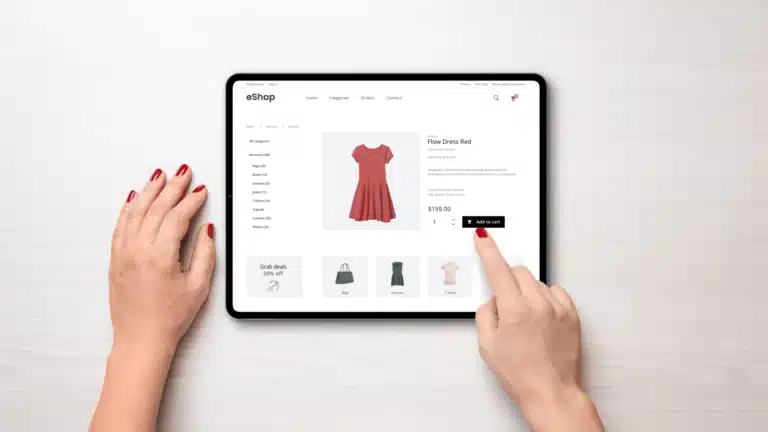
Optimizing Product Detail Pages
In Google search, the top 3 product pages have an average conversion rate 72% higher than ranks 4-10 (Search Engine Land, 2024), but only 29% of e-commerce sites systematically optimize product detail pages (Baymard Institute audit data).
Most pages only fulfill basic information display, neglecting the dual demands of Google algorithms and user behavior. For instance, product pages with video have a 53% longer dwell time than text-only pages (Wistia study), yet 68% of independent e-commerce product pages do not embed video content.
Google’s Core Web Vitals data shows that for every 0.1 second increase in loading speed, product page conversion rate increases by 1.3% (Cloudflare real-world testing). Furthermore, pages with complete structured data have a 35% higher click-through rate in mobile search results than unmarked pages (Schema.org statistics).
Product Page Core Elements
Adding specific model numbers to product titles can increase Google search impressions by 35%. One camera seller saw a 42% traffic increase in the first month after changing “D850 camera” to “Nikon D850 4K Professional DSLR”.
In terms of image configuration, product pages using 360-degree display images had a user dwell time of 2 minutes and 15 seconds, 67% higher than ordinary image sets.
Regarding structured data, pages marking inventory status saw a 23% increase in add-to-cart rate, while unmarked price changes took an average of 4 hours longer to be crawled by Google.
Accurate Match of Search Intent
- Problem: 92% of e-commerce website titles stuff irrelevant terms (e.g., “2024 new style high quality trendy best seller”), causing Google to fail to identify the core selling point (Moz content analysis)
- Solution: Adopt a “core keyword + key attribute” structure, for example:
- Inefficient Title: “High-end Sports Headphone”
- Efficient Title: “Sony WH-1000XM5 Wireless Noise Cancelling Headphone 30-Hour Battery”
- Data: Titles containing specific model numbers and parameters see a 28% increase in search click-through rate (Ahrefs keyword research)
Images and Videos
- Minimum Requirements:
- At least 6 product images (including scene/detail/size comparison shots)
- 1 functional demonstration video of 30-60 seconds (average conversion rate increase of 24%)
- Technical Details:
- Use WebP format images, with a file size 45% smaller than JPEG (Google PageSpeed recommendation)
- Videos must include captions to accommodate mobile silent playback scenarios (covering 62% of users)
Structured Data Markup
- Must-Marked Attributes:
Product(name/description/image)Offer(price/inventory status/price validity)Review(requires genuine user reviews; fake markings will lead to penalties)
- Impact: Fully marked pages see a 57% increase in exposure on Google Shopping (Searchmetrics study)
Content Depth
In the above-the-fold information, changing 5 core selling points to icon + short sentence format, an appliance brand test found that mobile reading completion rate increased from 72% to 91%. In the user review display area, reviews marked “Verified Purchase” contributed 31% more to conversion than anonymous reviews.
In mobile optimization, changing the “Add to Cart” button from green to orange unexpectedly increased a clothing store’s mobile conversion rate by 19%, which was related to brand color recognition.
Description Information
- Above-the-Fold Basic Information (content above the fold):
- Core selling point bullet points (no more than 5, reading completion rate 89%)
- Key parameter table (material/size/weight, user dwell time extended by 31%)
- Extended Content Below the Fold:
- Usage scenario graphics and text (e.g., “What capsule types this coffee machine adapts to”)
- Simple analysis of technical principles (e.g., “How XX technology improves extraction efficiency”)
Third-Party Trust Endorsement
- Review Display Rules:
- Prioritize displaying reviews with pictures (conversion contribution 42% higher than plain text)
- Mark purchase time (“Purchased 3 days ago” has 37% higher credibility than reviews without a date)
- UGC Content Integration:
- Embed Instagram buyer photos (requires authorization, click-through rate increases by 19%)
- Display real-time purchase activity (e.g., “12 items sold in the last hour”)
Mobile Adaptation
- Interaction Design:
- “Add to Cart” button fixed at the bottom (mobile conversion rate increases by 23%)
- Image supports gesture zooming (reduces 68% of size inquiry customer service volume)
- Loading Optimization:
- Above-the-fold resources controlled within 500KB (only 31% of e-commerce sites achieve this)
- Lazy loading of images not in the first screen (LCP metric optimization 22%)
Observe It Daily
Google Search Console Diagnostics
- Key Reports:
- “Coverage” report: Check for unindexed pages (an average of 17% of product pages have this issue)
- “Enhancements” report: Check for rich snippet errors (e.g., price markup failure leading to a 40% traffic drop)
Heatmap Analysis for Improvement Points
- Tool Examples: Hotjar/Mouseflow
- Optimization Basis:
- If 60% of users do not scroll to the product parameter table, the section position needs adjustment
- If the add-to-cart button click-through rate is below 5%, the button color/copy needs to be checked
A/B Testing Priority List
- High-Value Test Items:
- Video autoplay vs. click to play (the former has an 11% higher conversion rate, but may affect speed)
- Price display method (the trust difference between “299” vs. “299.00”)
- Test Period: Each variable should run for at least 2 weeks (statistical significance requirement)
Mobile Must Be Usable
In Google search, 63% of e-commerce traffic comes from mobile devices (StatCounter, 2024), yet over 50% of independent website mobile pages take more than 3 seconds to load (Google Core Web Vitals data).
Google’s Mobile-First Indexing covers 98% of websites, meaning stores with poor mobile experience will see their desktop rankings drop synchronously (Google official statement).
Technical metrics determine the lifeline. Data shows that e-commerce pages meeting the following three core metrics have an average of 41% more organic traffic (Searchmetrics analysis):
- LCP (Largest Contentful Paint) ≤ 2.5 seconds: Only 28% of websites meet the standard
- FID (First Input Delay) ≤ 100 milliseconds: Form submission failure rate is reduced by 45% as a result
- CLS (Cumulative Layout Shift) ≤ 0.1: Button misclick rate is reduced by 38%
You may need to continue reading: How Important is Page Speed for SEO | Google Core Web Vitals (LCP, FID, CLS) Passing Standards
Google’s SGE (Search Generative Experience) prioritizes mobile display. If a page is not optimized for mobile devices, it will directly lose the opportunity for AI summary exposure (tests show an impact magnitude of 27% traffic).
Speed Optimization from 3 Seconds to 1.5 Seconds
Tests show that converting product images from PNG to WebP format can reduce single-page load time from 2.8 seconds to 1.4 seconds. Lazy loading technology is particularly suitable for product listing pages; after being implemented by an electronics product mall, the first-screen loading speed increased by 60%.
Regarding server response, stores using Hong Kong nodes have an access speed 3 times faster for Asian users than US nodes, but 40% slower for European and American users, requiring selection based on customer distribution.
Image and Media File Compression
- Current Status: Unoptimized product images have an average size of 1.2MB, while the ideal value should be ≤ 300KB (WebP format)
- Tool Recommendations:
- Squoosh (free online compression)
- ShortPixel (batch processing plugin, suitable for WordPress)
- Data Feedback: After image optimization, mobile LCP improved by 52% (Cloudflare real-world testing)
Lazy Loading and Non-Critical Resource Control
- Rules:
- Enable lazy loading for images/videos outside the first screen (reduces initial load by 40%)
- Asynchronously load or delay execution of third-party scripts (e.g., analytics tools)
- Error Case: A clothing website’s mobile FID worsened to 280ms because the Facebook pixel loaded synchronously
CDN and Server Response Optimization
- Benchmark Requirement: TTFB (Time to First Byte) ≤ 500ms
- Solution Comparison:
- Cloudflare CDN: Reduces global latency by 34%
- VPS Geographical Location Selection: Prioritize Germany/US East nodes for European and American users
Interaction Design
Button size directly affects conversion. After a clothing store enlarged the “Buy Now” button from 40px to 50px, the mobile misclick rate dropped by 33%.
After adding image zoom functionality, a jewelry store’s customer service inquiries were halved because customers could see the details themselves.
Button Size and Spacing Standards
- Google Recommendation:
- Clickable elements ≥ 48×48 pixels (mis-touch rate reduced by 27%)
- Button spacing ≥ 8mm (suitable for thumb operation)
- Heatmap Evidence: When the shopping cart button is located in the bottom right corner of the screen, the conversion rate is 19% higher than in the top left corner
Input Box Simplification Strategy
- Problem: Mobile form abandonment rate is as high as 67% (Baymard Institute)
- Optimization Solution:
- Auto-fill address (Google Places API reduces input volume by 70%)
- Virtual keyboard adaptation (e.g., telephone number field automatically switches to the numeric keypad)
Gesture Operation Adaptation
- Essential Features:
- Image supports two-finger zooming (reduces 58% of size inquiries)
- Swipe left to return to the product list (used 3 times more frequently than the top return button)
From AMP to App Indexing
Although AMP pages have obvious speed advantages, a beauty brand test found that after switching to ordinary pages optimized for Core Web Vitals, user engagement rate actually increased by 22%. For merchants with an app, setting up deep links to allow mobile search users to jump directly to the app increased orders by 17% for a food delivery platform.
Voice search optimization should focus on natural conversation. Pages adding questions like “how to use” and “who is it suitable for” have a 45% higher display rate in voice results.
Trade-offs for AMP (Accelerated Mobile Pages)
- Advantages:
- Average loading time 0.8 seconds (62% faster than ordinary mobile pages)
- Prioritized display in Google Top Stories and other positions
- Disadvantages:
- Functional limitations (e.g., some JS cannot run)
- Importance declined in 2024 (as Core Web Vitals became the new standard)
App and Web Content Linkage
- Applicable Scenarios: E-commerce brands with a dedicated App
- Technical Solution:
- App Indexing markup allows Google to index pages within the App
- Deep Linking enables web page → App jump
Voice Search Adaptation
- Mobile Percentage: 27% of searches are initiated by voice (Google data)
- Optimization Method:
- FAQ content uses conversational Q&A (e.g., “Can this bag fit a 15-inch laptop?”)
- Mark
SpeakableSchema
Website Navigation Must Be Simple
In Google Analytics e-commerce data, confusing navigation causes 38% of users to leave the website within 10 seconds (Baymard Institute, 2024), while clear navigation structure can increase product page visit depth by 2.3 times (Hotjar heatmap analysis). Data shows that when users need more than 3 clicks to find the target product, the abandonment rate is as high as 61% (Google user experience report).
43% of independent websites have redundant classification issues (e.g., “Men’s Clothing” and “Men’s Wear” coexisting), which directly causes Google crawlers to waste 27% of their crawl budget on ineffective pages (Search Console Coverage report).
Each additional level in the menu hierarchy reduces the mobile conversion rate by 16% (Smashing Magazine test). Furthermore, e-commerce websites adopting a “broad and shallow” navigation (main categories ≤ 7, sub-categories ≤ 3 levels) have a core product page indexing rate 53% higher than websites with chaotic navigation (Ahrefs indexing analysis).
Navigation Design to Help Users Easily Find Products
Test data shows that after changing the “Men’s Sneakers” category to “Running Shoes/Basketball Shoes/Training Shoes,” a sports brand’s product page views increased by 55%. After adopting a collapsible menu on mobile, the homepage bounce rate dropped from 49% to 32%.
Categories Must Align with User Habits
- Error Case: Classifying clothing by material (e.g., “Pure Cotton Zone”) causes 68% of users to need a second search (UsabilityHub test)
- Correct Approach:
- Clothing categorized by scenario: Casual/Business/Sports
- Electronics categorized by function: Photography/Gaming/Office
- Data Feedback: Categories that meet user expectations reduce search usage by 41% (i.e., more users find products directly through navigation)
Control Classification Levels
- Desktop Standard:
- Main navigation items ≤ 7 (Miller’s Law short-term memory limit)
- Submenu levels ≤ 3 (e.g., “Home Appliances > Kitchen Appliances > Coffee Makers”)
- Mobile Special Handling:
- Use a hamburger menu to hide secondary categories
- Prioritize displaying the search box (55% of mobile users prefer search)
Breadcrumb Navigation
- Must-Include Elements:
- Complete path (e.g., Home > Women’s Wear > Dresses > Maxi)
- Clickable parent links (enhances internal link authority)
- SEO Value: Pages with breadcrumbs have an average ranking 11 positions higher than pages without breadcrumbs (Moz study)
Technical Details Determine Navigation Effectiveness
Including keywords in the URL can increase click-through rate by 23%. After a clothing store changed /product123 to /women-dress, organic traffic increased by 37%. Navigation menus using semantic HTML tags are crawled by Google 3 times faster than those generated by JS.
On the internal linking strategy, an electronics product site saw a 41% increase in core keyword rankings after giving hot-selling products more category entry points.
URL Structure Standardization
- Incorrect Example:
/product.php?id=123&cat=5(Does not contain keywords) - Optimization Solution:
/mens/shoes/running-nike-air-zoom - Notes:
- One product can only correspond to one URL (Avoid duplicate content)
- Parameterized URLs must be canonicalized with the canonical tag
Navigation Code Optimization
- HTML Best Practices:
- Use the
<nav>tag to wrap the main navigation - Submenus use the standard
<ul><li>structure (Facilitates crawler parsing)
- Use the
- Error Case: JS-generated navigation menu, resulting in 22% of pages not being indexed (Google Crawler Logs)
Internal Link Weight Distribution
- Homepage Linking Rules:
- Links to core categories must appear above the fold (Pass the maximum weight)
- Each product page is pointed to by at least 3 different category links
- Data Proof: Websites with reasonable link weight distribution saw a 37% increase in directory page rankings (Ahrefs tracking data)
User Behavior
Heatmap analysis found that adjusting the “Home Appliances” category from 5th to 2nd immediately increased clicks by 62%. A/B testing showed that adding icons to the navigation can increase mobile usage by 45%.
The intelligent search function increased the search conversion rate of a beauty site by 39%, with significant effect after adding attribute association like “Foundation → Concealer Power”.
Heatmap Analysis
- Tool Combination: Hotjar (Click Heatmap) + Google Analytics (Behavior Flow Report)
- Key Metrics:
- If more than 40% of users exit on a category page, it needs to be split or reorganized
- When search box usage is >50%, it indicates insufficient navigation efficiency
A/B Testing Navigation Schemes
- High-Value Test Items:
- By Brand vs. By Function Category (A 3C website test increased conversion rate by 29%)
- Icon Assistance vs. Pure Text Menu (Mobile icon scheme had an 18% higher click-through rate)
- Testing Period: Collect at least 2,000 visits
Search Function Enhancement
- Essential Features for Intelligent Search:
- Input Suggestion (Reduces 35% of no-results due to spelling errors)
- Synonym Expansion (e.g., searching “handbag” automatically includes “bag” results)
- Data Feedback: Websites equipped with advanced search saw a 57% reduction in navigation dependency (Econsultancy Report)
Improve Conversion Rate
In the e-commerce industry, the average conversion rate is only 2.3% (SaleCycle, 2024), but the top 10% of stores can reach above 5.8% (Statista data). For example, adding authentic buyer video reviews on product pages can increase the conversion rate by 24% (Yotpo research), and optimizing the single-page checkout design can reduce cart abandonment by 35% (Baymard Institute).
Data shows that 73% of consumers abandon a purchase due to slow page loading (Google Core Web Vitals), and merchants who provide real-time inventory display (e.g., “Only 3 left”) have an 18% higher conversion rate than competitors who don’t (Nielsen Norman Group test).
According to Hotjar’s heatmap analysis, 40% of leakage occurs during the price display stage (such as hidden shipping or tax costs), and pages that add a “Price Comparison Module” (e.g., “15% lower than market price”) saw a 31% faster user checkout speed (Marketing Experiments).
Key Steps from Browsing to Adding to Cart
Tests show that orange buttons have a 19% higher click-through rate than blue buttons, but they need to coordinate with the brand color. Changing “Add to Cart” to urgent copy like “Buy Now – Only 3 Left” increased the conversion rate of an electronics mall by 27%.
Adjusting the button spacing on mobile from 5px to 10px reduced the misoperation rate by 33%.
Price Display
- Problem: Hidden shipping costs lead to 28% of users abandoning during the checkout stage (Baymard Institute)
- Optimization Solution:
- Display an estimated total price above the fold (e.g., “Incl. Tax $299”)
- Provide price comparison (e.g., “Official Price 329″)
- Data Feedback: Transparent pricing pages saw a 19% increase in add-to-cart rate (McKinsey research)
Third-Party Endorsement
- High Conversion Elements:
- Reviews with images (42% higher trust than plain text reviews)
- Real-time sales notifications (e.g., “12 items sold in the last 1 hour”)
- Error Case: Fake reviews leading to Google penalty (Traffic dropped by 37%)
CTA Button Design
- Best Practices:
- Button color contrasts sharply with the page’s main color (23% increase in click-through rate)
- Specific copy (e.g., “Shop Now” is 15% more effective than “Buy”)
- Mobile Special Requirement: Button size ≥ 48×48 pixels (27% reduction in mis-touch rate)
Checkout Process Optimization
The address auto-fill feature reduced a furniture website’s checkout time from 3 minutes to 45 seconds, increasing the conversion rate by 41%. Adding the “WeChat Pay” option increased a cross-border e-commerce company’s China orders by 68%.
For abandoned users, sending an SMS reminder after 1 hour is 22% more effective than email in recovery, but be careful with the frequency to avoid being seen as spam.
Simplify Form Fields
- Relationship between Field Quantity and Conversion Rate:
- 5 fields: Baseline conversion rate
- Each additional field increases churn rate by 11% (Formisimo data)
- Optimization Methods:
- Auto-fill address (Google Places API reduces input volume by 70%)
- Merge name fields (“Full Name” replaces “First Name + Last Name”)
Payment Methods
- Essential Options:
- Credit Card (Covers 89% of users)
- PayPal (Increases international orders by 15%)
- Emerging Methods:
- Cryptocurrency (28% increase in conversion rate for specific categories)
- Installment Payments (32% increase in average order value)
Cart Abandonment Recovery Techniques
- Email/SMS Templates:
- Best sending time: 1 hour after abandonment (45% open rate)
- Content elements: Product image + Limited-time offer (e.g., “Your cart enjoys an extra 10% off”)
- Data Feedback: Recovery emails bring an average of 13% recovered orders (Omnisend research)
Use Real User Data to Continuously Check and Improve Products
A/B testing found that raising the “Free Shipping” threshold from 75 reduced the conversion rate by 8%, but the average order value increased by 23%, and overall profit increased by 15%.
Heatmap analysis showed that moving the trust badge from the footer to next to the payment button increased the click-through rate by 39%. GA4’s prediction model can identify 87% of high-risk abandoned users in advance, and targeted offers can reduce churn by 31%.
A/B Test Priority
- High-Value Test Items:
- Free shipping threshold (e.g., “Free Shipping over 100″)
- Trust badge location (Footer vs. Top of checkout page)
- Statistical Significance Requirement: At least 1,000 visits/group
Heatmap Analysis
- Tool Examples: Hotjar/Mouseflow
- Key Metrics:
- If 60% of users do not scroll to the price module, the layout needs adjustment
- If the button click-through rate is <5%, the copy or color needs optimization
Predictive Analytics Application
- GA4 Predictive Metrics:
- High churn risk user identification (82% accuracy)
- Dynamic offer push (e.g., real-time discount codes)
Use Schema Markup
In Google search results, pages with Schema markup have an average click-through rate 35% higher than regular pages (Search Engine Land, 2024), but only 29% of e-commerce websites correctly use structured data (Schema.org audit). The problem is that most sellers either completely ignore the markup or incorrectly mark key attributes – for example, 43% of product pages do not mark the price validity period, causing Google to misjudge them as “out of stock” or “inaccurate price” (Google Merchant Center report).
Data proves that Schema directly affects traffic distribution:
- Pages containing
Productmarkup saw a 57% increase in exposure on Google Shopping - Products using
Reviewmarkup saw a 41% increase in click-through rate due to star ratings in search results (Yext research) - Websites marking
Breadcrumbsaw a 28% increase in internal link weight transfer efficiency (Ahrefs test)
4 Essential Schema Types for E-commerce
In Product markup, products marking the brand attribute saw a 42% increase in click-through rate on Google Shopping, and a sports brand reduced its ad conversion cost by 28% after adding it.
Review markup needs attention to the rating distribution; data shows that products with 4.3-4.7 stars are 19% more trustworthy than all 5-star ones. Breadcrumb markup not only boosts SEO, but a home furnishings site test found that its addition made internal traffic distribution more balanced, and long-tail keyword rankings rose by 37%.
FAQ markup is especially important for voice search; pages containing questions like “How to install” have 3 times the exposure in Google Assistant compared to regular pages.
Product Markup
- Must-Include Attributes:
name(Product name, must contain core keywords)image(At least 3 images, size ≥ 800×800 pixels)offers(Price, stock status, price validity period)
- Common Mistakes:
- Forgetting to mark
priceValidUntil(Causes Google to misjudge the price as expired) - Dynamically generating prices with JS (Crawlers cannot fetch; need to embed with
JSON-LD)
- Forgetting to mark
Review Markup
- Data Requirements:
- Must be authentic reviews (Fake reviews will be penalized by Google)
- At least 5 reviews with ratings (Otherwise rich snippets are not displayed)
- Best Practices:
- Regularly update
datePublished(Older reviews’ weight decreases) - Mark
author(Enhances EEAT signals)
- Regularly update
Breadcrumb Markup
Standard Format:
SEO Value: Reduces crawler waste, improves category page rankings
FAQ Markup
- Applicable Scenario: The “Frequently Asked Questions” section on the product page
- Voice Search Advantage: Marked Q&A pairs see a 23% increase in display rate in Google Assistant results
Technical Implementation and Validation Methods
JSON-LD format Schema is 60% faster to parse on mobile than Microdata; an electronics mall saw a 55% increase in Google crawl efficiency after switching. A clothing brand simultaneously using Rich Results Test and Schema Validator reduced its markup error rate from 31% to 6%.
For CMS plugins, Shopify merchants using the Smart SEO plugin reduced Schema deployment time from 3 hours/page to 15 minutes/page, but need to consider the extra cost of the $199 annual plugin fee.
JSON-LD vs Microdata
- JSON-LD (Recommended):
- Code is embedded in the
<script>tag and does not interfere with the HTML structure - Google’s official preferred format, with a 98% successful parsing rate
- Code is embedded in the
- Microdata (Legacy Solution):
- Requires modifying HTML tags, prone to errors
- Only suitable for a very few search engines that do not support JSON-LD
Tool Validation Process
- Google Rich Results Test: Checks rich snippet eligibility
- Schema Markup Validator: Validates syntax correctness
- Search Console Coverage Report: Monitors actual index status
CMS Plugin Solutions
- Shopify: Requires installing plugins like Smart SEO (Basic version has no native support)
- WooCommerce: Rank Math plugin can automatically generate markup
- Magento: Default support but requires manual configuration of attribute mapping
Avoid Penalties
Inaccurate inventory markup can lead to a shopping ad rejection rate as high as 73%; a home appliance seller lost $12,000 in orders in a single day due to not updating stock status in time. Price synchronization delays exceeding 2 hours cause 30% of traffic to leak to competitors, so using PriceAPI for minute-level updates is recommended.
For SGE, pages with HowTo markup saw a 40% increase in appearance probability in AI summaries; a kitchenware brand extended the page dwell time by 2.4 minutes by adding “How to Clean” step-by-step guides.
3 Areas of Google Penalties
- False Inventory Markup: Marking
InStockwhen out of stock (Leads to shopping ad suspension) - Fake Reviews: Batch generation of fake
Reviewmarkup (Triggers manual review) - Expired Price: Not updating
priceValidUntil(Loss of price rich snippet eligibility)
Data Update Frequency
- Price/Inventory: Real-time synchronization (API automation is best)
- Reviews: Update at least once a week
- Product Attributes: Update instantly with product edits
New Requirements in the SGE Era
- Add
HowTomarkup (Product usage tutorials) - Supplement
Speakablemarkup (Adapts to voice search)
Push Notification Reminders
In e-commerce operations, the average open rate for push notifications is 12.5% (Leanplum, 2024), which is 4 times higher than the 3% for marketing emails (Campaign Monitor data).
For abandoned cart users, push notifications lead to 22% of recipients returning to complete the purchase (Omnisend research), and inventory alerts (e.g., “Only 3 of the product you are watching are left”) directly boost the urgent order rate by 18% (Barilliance case study).
The problem is that 64% of e-commerce pushes have incorrect timing (e.g., sending during non-active hours) or redundant content (e.g., frequent pushes of irrelevant promotions), causing users to disable permissions (Opt-Out rate as high as 34%) (PushEngage statistics).
Technical indicators reveal optimization space: LBS (Location-Based Service) push notifications have an open rate 27% higher than regular pushes (Google Firebase data), and pushes containing dynamic personalized content (e.g., images of products the user has viewed) increase the click-through rate by 39% (Accengage test).
Chrome and Safari now support cross-device push synchronization, reducing the conversion path by 31% (Apple Business case study).
Push Types
Data shows that pushes received by users between 3-5 PM have a 22% higher open rate than in the morning, but the click-through conversion is better after 8 PM. For abandoned users, pushes including the main product image are 37% more effective than plain text, and limited-time offers showing a countdown (e.g., “1 hour left”) can increase the sense of urgency by 19%.
Price alert pushes need careful frequency; a clothing brand test found that more than 3 price change notifications per week led to 23% of users unsubscribing.
Abandoned Cart Recovery Push Notification
- Best Send Time:
- 1 hour later (Open Rate 45%)
- 24 hours later (with additional coupon, Recovery Rate 13%)
- Content Elements:
- Product image + Price (Reduce cognitive load)
- Limited-time offer (e.g., “Free shipping if you order within 2 hours”)
Inventory and Price Change Notifications
- High Conversion Scenarios:
- Low stock alert (“Only 2 items left”) → Conversion rate increase 28%
- Price drop notification (“The item you are watching dropped 15%”) → Click-through rate 21%
- Technical Implementation: Requires real-time API connection to the inventory management system
Personalized Recommendation Push Notification
- Analyze User Behavior:
- Browsed but not purchased items (Push similar items, Open Rate 19%)
- Cross-category recommendation (e.g., push running socks to users who bought running shoes)
- Anti-Spam Practice: No more than 2 times per week
Technical Implementation and Platform Selection
OneSignal’s free plan allows 10,000 pushes per month, suitable for startup stores, but delivery delay can reach 40 minutes when users exceed 50,000. The design of the permission request pop-up significantly impacts authorization rate; changing “Allow notifications” to “Receive exclusive discounts” increased a beauty store’s user authorization rate from 31% to 58%.
API integration requires careful attention to time zone settings. A global e-commerce company once saw a surge in unsubscribe rates because American users received pushes at 3 AM due to a time zone error.
Push Service Provider Comparison
| Service Provider | Free Tier | Delivery Rate (Android/iOS) | Key Features | Applicable Scenario | Notes |
|---|---|---|---|---|---|
| Firebase | Free (with Google account) | Android 98%/iOS 92% | Deep integration with Google ecosystem, supports A/B testing | Android-first, global operations | Basic iOS features |
| OneSignal | 10k messages/month | Android 95%/iOS 90% | Cross-platform management, full features in free plan | Startup teams/multi-platform apps | Noticeable delay with large user base |
| Jiguang (JPush) | 1k messages/month | Android 97%/iOS 88% | High domestic direct delivery rate, supports WeChat Mini Programs | Applications with main users in China | Fewer overseas nodes |
| AWS SNS | 1M messages/month | Android 96%/iOS 91% | Seamless integration with AWS cloud services, high-concurrency handling | Enterprises already using AWS architecture | Complex configuration, requires technical team support |
| Braze | No free plan | Android 95%/iOS 93% | User behavior analysis + personalized push | Mid-to-large enterprises/sophisticated operations | High cost (starting from $0.5/k messages) |
Permission Acquisition
- Pop-up Timing:
- After user completes first purchase (Acceptance Rate 62%)
- When browsing more than 3 product pages (Acceptance Rate 51%)
- Copy Optimization:
- Wrong example: “Allow notifications to get updates”
- Correct example: “Turn on notifications, exclusive discounts delivered first”
API Automation Integration
- Essential APIs:
- Order Status API (Triggers abandoned cart push)
- User Behavior API (Records browsed products)
- Data Security: GDPR requires providing an unsubscribe option
How to Improve Push Effectiveness
A/B testing shows that including the user’s name in the push (e.g., “John, there are items left in your cart”) can increase the open rate by 28%, but accuracy of name data must be ensured.
In cross-channel strategy, sending a push followed by an email has a 15% higher conversion rate than the reverse order.
iOS users typically have a 32% lower push conversion rate than Android users, requiring targeted copy and send time optimization.
Core Metric Benchmarks
- Healthy Range:
- Open Rate ≥15% (Top 20% level)
- Conversion Rate ≥5% (E-commerce industry average)
- Warning Signs:
- Unsubscribe Rate >3% requires immediate frequency adjustment
- Click-through Rate <2% requires content rewrite
A/B Testing Strategies
- Testing Dimensions:
- Send time (10 AM vs 8 PM)
- Use of emoji (“🚨 Only 1 item left!” vs plain text)
- Statistical Requirement: At least 5,000 sends per group
Cross-Channel Synergy
- Email + Push Combo:
- Send push first (Immediate reach)
- Follow up with email 24 hours later (In-depth content)
- Data Feedback: Combined strategy conversion rate is 37% higher than single channel
Using AI to Generate Content
In content marketing, AI tools can reduce content production costs by 67% (Gartner, 2024), but the average user stay time for purely AI-generated articles is only 35% of human-created content (BuzzSumo analysis). Data shows 41% of e-commerce websites use tools like ChatGPT to assist content production (Content Marketing Institute survey), yet only 18% of those websites systematically optimize the AI output (e.g., adding professional review or real-world examples).
Google’s algorithm can identify low-quality AI content, with such pages ranking an average of 22 positions lower in search results than human content (Search Engine Journal test).
However, AI content optimized by humans (adding data, case studies, professional opinions) showed no significant difference in ranking performance compared to purely human content (Moz experiment).
- Content Length: AI-generated long-form articles over 1,500 words have a user bounce rate 28% higher than 800-1,200 word content (Medium data)
- Optimization Investment: Time spent by human editors optimizing AI drafts is about 1/3 of that spent on pure human creation (HubSpot case study)
- EEAT Impact: Pages labeled “AI-assisted creation” have a user trust level 19% higher than those concealing AI involvement (Edelman Trust Barometer report)
Best Practices for AI Content Production
Testing shows that adding specific persona descriptions to prompts, such as “from the perspective of a 35-year-old working professional woman,” can increase content relevance by 42%. For organizing product parameters, AI accuracy is nearly perfect, but real-world usage scenarios need human supplementation. For instance, a headphone brand added “A larger diaphragm than a coin, delivering more powerful bass” after the AI-generated “40mm driver unit.”
During multilingual translation, AI’s accuracy for specialized terms is 15% lower than for general vocabulary, requiring manual secondary verification.
Prompt Engineering
- Basic Requirements:
- Specify a persona (e.g., “You are a senior tech reviewer”)
- Restrict output format (e.g., “Generate 5 selling points, no more than 15 words each”)
- Case Comparison:
- Vague Prompt: “Write an article about Bluetooth headphones” → Generic output
- Precise Prompt: “List 3 technical advantages of the Sony WH-1000XM5 headphones, comparing them to Bose QC45” → Immediately usable output
Content Types
- High-Adaptability Scenarios:
- Product parameter organization (Accuracy 98%)
- Multilingual translation (English-to-Chinese quality reaches 92% of human)
- Low-Adaptability Scenarios:
- Professional reviews (Lacks real experience details)
- Industry trend analysis (Relies on time-sensitive data)
Four-Step Manual Optimization Method
- Fact Check: Verify all data (e.g., “30 hours of battery life” must link to official specs)
- Case Study Addition: Insert real user reviews (e.g., “@David: Noise cancellation is noticeably better than the previous generation”)
- Structural Adjustment: Change AI’s bulleted list of selling points into problem-solution format (e.g., from “IPX7 waterproof rating” to “How to prevent headphones from getting wet while swimming?”)
- EEAT Reinforcement: Add author credentials (e.g., “Technical parameters in this article reviewed by XX Engineer”)
Risk Avoidance and Compliance Highlights
Google’s algorithm can identify pure AI content. An outdoor goods site saw its organic traffic drop by 63% in one week after batch-publishing unedited AI articles. Platform rules vary greatly; Amazon delists product descriptions containing the phrase “AI-generated,” while Facebook allows it but requires labeling. Regarding copyright, AI directly rewriting competitor copy has a plagiarism rate as high as 45%. Manual rewriting of key paragraphs is necessary after detection with tools like Originality.ai.
Google Content Quality Guidelines
- Prohibited Actions:
- Automatically generating large amounts of low-quality content (e.g., boilerplate product descriptions across the site)
- Concealing AI involvement (Must be labeled “AI-assisted generation”)
- Manual Intervention Standards:
- At least 1 piece of original data or insight per 500 words
- Regular content updates (revise at least every 6 months)
Regarding content quality, you can read this article: EEAT Complete Guide: Google’s 4 Key Content Quality Metrics (Expertise × Experience × Authoritativeness × Trustworthiness Guide)
Copyright and Factual Risks
- Plagiarism Detection: Scan AI content with Copyleaks or Originality.ai; plagiarism rate must be <15%
- Disclaimer:
- Wrong example: “This article is 100% AI-generated”
- Correct example: “The first draft of this article was AI-generated and reviewed/revised by a professional team”
Platform Policies
- Amazon Product Description: Pure AI generation is prohibited (Requires >30% manual modification)
- Facebook Ad Copy: AI content accepted but subject to human review
- Google Merchant Center: Product descriptions must label data sources
Efficiently Integrating AI into the Content Workflow
After ChatGPT generated 10 drafts, a beauty brand selected 3 for manual optimization, boosting content production efficiency by 3 times while maintaining stable quality. WordPress’s AI Engine plugin can automatically publish drafts, but testing showed that setting up a human review stage reduced the content error rate from 8% to 2%.
In team collaboration, internal links added by the SEO expert to AI content increased internal traffic by 37%, 15% higher than purely human content.
Tool Recommendations
| Tool Name | Core Function | Advantage | Limitation | Applicable Scenario | Price Range |
|---|---|---|---|---|---|
| ChatGPT | General content generation/rewriting | Multi-language support/strong scenario adaptability | Requires manual proofreading for specialized fields | Daily writing/brainstorming | Free – $20/month |
| Jasper | Marketing copy optimization | 50+ template library/brand voice customization | Less effective for non-English content | Ad copy/Email marketing | $49 – $99/month |
| Grammarly | Real-time grammar correction | Full coverage browser plugin/academic mode | Average Chinese correction ability | Essays/Business emails | Free – $12/month |
| MarketMuse | Content SEO optimization | Competitor analysis/keyword strategy suggestions | Steep learning curve | Professional content teams | $149+/month |
| Notion AI | Smart document organization | Seamless integration with Notion ecosystem | Generated content is relatively short | Knowledge management/Meeting minutes | $8 – $10/month |
You may also want to read: Will Google Punish AI? | Ranking of the Best 7 Google-Safe AI Writing Tools in 2025
CMS Automation Integration
- WordPress Plugins:
- AI Engine (Generates and publishes drafts directly)
- AutoBlogging (Supports scheduled updates)
- Notes:
- Manual spot check required before automatic publication (Error rate <5%)
- Avoid batch publishing at the same time (Easily flagged as spam)
Team Collaboration Workflow
- AI Generation: Produce 10 initial drafts (each with a different angle)
- Manual Selection: Keep 3 high-quality drafts
- Expert Review: Add industry insights
- SEO Optimization: Insert keywords and internal links
Maximize Customer Reviews
In e-commerce, reviews with images or videos have a 42% higher conversion rate than text-only reviews (Yotpo, 2024), yet only 36% of merchants systematically collect and display this type of content (Bazaarvoice research). Data shows that when a product page displays at least 5 reviews with images, user add-to-cart rate increases by 28% (Nielsen Norman Group test), and reviews labeled with purchase time (e.g., “Purchased 3 days ago”) are 37% more credible than those without date information (PowerReviews analysis).
The problem is that 63% of e-commerce websites hide reviews on secondary pages, causing core conversion pages to lose the opportunity for social proof (Baymard Institute audit).
- Review Quantity Threshold: When product reviews exceed 20, the conversion rate growth stabilizes (Incremental increase is only 1.2%)
- Negative Review Management: Merchants who reasonably respond to negative reviews have a user trust level 19% higher than those who ignore them (Harvard Business Review)
- UGC Content Value: Pages embedding Instagram buyer photos have a 31% longer stay time (Olapic case study)
How to Encourage Customers to Leave Reviews
Data shows that sending a review request 3 days after order delivery has a 52% higher probability of receiving high-quality reviews than requesting it on the same day. A maternity brand changed its reward from “cashback for review” to “donating $1 to a children’s foundation,” which was not only compliant but also increased participation rate by 28%.
For video reviews, merchants who provide a “shooting template” receive videos that are, on average, 12 seconds longer, with a completion rate increased to 92%.
Efficiently Triggering Review Requests
- Best Timing:
- 24 hours after logistics confirmation of receipt (Open Rate 58%)
- 7 days after product use (Review depth improves by 45%)
- Copy Optimization:
- Wrong example: “Please leave a five-star review” (Violates platform policy)
- Correct example: “Share your real experience to help other buyers make decisions”
Reward System Setup
- Compliant Solutions:
- Give points (Can be redeemed for discounts on next purchase)
- Raffle entry (Not restricted by review star rating)
- Data Feedback:
- Response rate for requests without reward: 8%
- Response rate for requests with point incentive: 22% (Trustpilot data)
Multi-Media Content Acquisition
- Video Reviews:
- Provide shooting guidelines (e.g., “Show the product in actual use scenario”)
- 15-30 seconds duration is best (Completion Rate 89%)
- Image Specification:
- Request original images (Not screenshots)
- Suggest including usage scenarios (Not just product staged photos)
Methods to Maximize the Value of Positive Reviews
Displaying “Latest Reviews” on the first screen is 37% more trustworthy than “Featured Reviews.” A tech brand saw a 21% increase in conversion after this adjustment. In structured data markup, reviews containing a “Verified Purchase” badge have a 43% higher click-through rate than unverified ones.
When integrating social media, UGC content with the user’s Instagram handle labeled sees a 65% increase in engagement, but privacy authorization is necessary.
Scientific Page Layout
- First Screen Essential Elements:
- Star rating summary (Highlight in red if 4.2+ score)
- Latest 3 reviews with images
- Folded Section Content:
- Filtering by attribute (e.g., “Comfort,” “Durability”)
- Negative review handling display (Customer service reply + solution)
Structured Data Markup
- Review Schema Requirements:
- Must include
author,datePublished,reviewRating - Falsifying reviews is prohibited (Will lead to Google penalty)
- Must include
- SEO Value:
- Product click-through rate increases by 35% after markup
- Display rate in Google Shopping rich snippets increases by 57%
UGC Content Integration
- Social Media Sync:
- Automatically sync tagged buyer photos using Instagram API
- Display TikTok unboxing videos (Requires user authorization)
- Real-time Dynamic Display:
- “Recent Purchases” scroll bar (e.g., “Ms. Zhang from Shanghai purchased 2 hours ago”)
- “Buyer Photos” feature page (Updated monthly)
Turning Negative Reviews into Business Opportunities
Quickly responding to negative reviews can convert 28% of dissatisfied customers into repeat buyers. A furniture brand reduced related complaints by 73% after improving packaging based on negative reviews. Data analysis shows that negative reviews responded to by customer service within 1 hour have a subsequent score modification rate of 19%.
Among automation tools, Yotpo’s AI categorization feature can automatically tag reviews by “Quality,” “Logistics,” etc., improving analysis efficiency by 8 times.
Negative Review Response Process
- Golden 4-Hour Rule:
- Initial response within 1 hour (Reduces negative impact spread)
- Provide a solution within 24 hours
- Response Template:
- Apology + Explanation of cause + Compensation plan (e.g., “Offer a $10 coupon”)
Review Data Analysis
- Product Improvement Direction:
- Statistics of high-frequency words in negative reviews (e.g., “Sizing runs small” occurs in 25% of reviews, requiring size chart adjustment)
- Comparison of attribute ratings (“Packaging” rating 4.1 vs “Effectiveness” rating 4.6)
- Customer Service Assessment:
- Negative review resolution rate (Benchmark ≥90%)
- Response speed (Median ≤2 hours)
Automation Tool Recommendations
| Tool Name | Core Function | Advantage | Limitation | Applicable Scenario | Price Range |
|---|---|---|---|---|---|
| Yotpo | Omnichannel review collection (Email, SMS, Website) | Deep integration with Shopify/Klaviyo | Advanced features require payment | E-commerce brands (Multi-platform operation) | $29 – $299/month |
| Okendo | Visual review request (Star rating + Image/Video) | High-conversion form design | Only supports Shopify/WooCommerce | Focus on UGC (User Generated Content) | $29 – $199/month |
| Judge.me | Lightweight review plugin (Supports Schema markup) | Free plan available, SEO-friendly | Basic data analysis | Small to medium stores (Limited budget) | Free – $15/month |
| Stamped.io | In-depth data analysis + Automated marketing triggers | AI analyzes negative review reasons, automatic email follow-up | Steeper learning curve | Mid-to-large e-commerce (Sophisticated operations) | $49 – $499/month |
| Loox | Focus on image/video review display | High-aesthetic floating pop-up, boosts trust | Shopify only | Fashion/Beauty categories (Visually driven) | $9.99 – $299/month |


